A new study published by the Proceedings of the National Academy of Sciences of the United States of America (PNAS) is predicting a grim future for wildfires and the resulting toxic smoke. Here is the abstract of their newly concluded study:
Full Research Publication: https://www.pnas.org/content/118/2/e2011048118#F1
Increase in Deadly Global Wildfires
Recent dramatic and deadly increases in global wildfire activity have increased attention on the causes of wildfires, their consequences, and how risk from wildfire might be mitigated. Here we bring together data on the changing risk and societal burden of wildfire in the United States. We estimate that nearly 50 million homes are currently in the wildland–urban interface in the United States, a number increasing by 1 million houses every 3 y. To illustrate how changes in wildfire activity might affect air pollution and related health outcomes, and how these linkages might guide future science and policy, we develop a statistical model that relates satellite-based fire and smoke data to information from pollution monitoring stations.
Wildfires have Accounted for up to 25% of PM2.5 Particulate Matter in the United States
Using the model, we estimate that wildfires have accounted for up to 25% of PM2.5 (particulate matter with diameter <2.5 μm) in recent years across the United States, and up to half in some Western regions, with spatial patterns in ambient smoke exposure that do not follow traditional socioeconomic pollution exposure gradients. We combine the model with stylized scenarios to show that fuel management interventions could have large health benefits and that future health impacts from climate-change–induced wildfire smoke could approach projected overall increases in temperature-related mortality from climate change—but that both estimates remain uncertain. We use model results to highlight important areas for future research and to draw lessons for policy.
Burn Areas from Wildfires in the US is up to 400% the Last Four Decades
Over the past four decades, burned area from wildfires has roughly quadrupled in the United States (Fig. 1A) (1). This rapid growth has been driven by a number of factors, including the accumulation of fuels due to a legacy of fire suppression over the last century (2) and a more recent increase in fuel aridity (Fig. 1B, shown for the western United States), a trend which is expected to continue as the climate warms (3, 4). These increases have happened parallel to a substantial rise in the number of houses in the wildland–urban interface (WUI). Using data on the universe of home locations across the United States and updated national land cover maps, we update earlier studies (5, 6) and estimate that there are now ∼49 million residential homes in the WUI, a number that has been increasing by roughly 350,000 houses per year over the last two decades (Fig. 1C and SI Appendix). As firefighting effort focuses substantially on the protection of private homes (7), these factors have contributed to a steady rise in spending on wildfire suppression by the US government (Fig. 1D), which in recent years has totaled ∼$3 billion/y in federal expenditure (1). Total prescribed burn acreage has increased in the southeastern United States but has remained largely flat elsewhere (Fig. 1E), suggesting to many that there is underinvestment in this risk-mitigation strategy, given the massive overall growth in wildfire risk (8).

Trends in the drivers and consequences of wildfire. (A and B) Increases in burned area in public and private US lands (A) (1) have been driven in part by rising fuel aridity, shown here over the western United States (4) (B). (C and D) The number of homes in the WUI has also risen quickly (C, our calculations; SI Appendix), which has contributed to rising suppression costs (D) incurred by the federal government. (E) Prescribed burn area has increased substantially in the South but is flat in all other regions (1). (F and G) Smoke days have increased throughout the United States (F), perhaps undermining decadal improvements in air quality across the United States (G). (H) We calculate an increasing proportion of overall attributable to wildfire smoke, particularly in the West. Red and blue lines in each plot indicate linear fits to the historical data, with slopes reported in the upper left of each panel; all are significantly different from zero (P <0.01 for each), except for prescribed burn in regions outside the South. Red lines indicate underlying data are from published studies or government data, and blue lines indicate novel estimates from this paper.
Growing Concerns
What are the consequences of this change in fire activity for overall air quality and for health outcomes, and how should policy respond? Large increases in wildfire activity have been accompanied by substantial increases in the number of days with any smoke in the air across the United States (Fig. 1F), as estimated from satellite data (9). Such increases have been observed throughout the continental United States, not just in the West, and threaten to undo the substantial improvements in air quality observed across the United States over the last two decades (Fig. 1G). The fingerprints of wildfire are already visible in upward-trending spring- and summertime organic carbon concentrations observed in rural areas in the US South and West (SI Appendix, Fig. S1), respectively, and studies find that having any smoke in the air can increase morbidity and mortality among exposed populations (10, 11).
A Challenge for Population Centers
A challenge in understanding the broader contribution of changing wildfire activity to air quality is the difficulty in accurately linking fire activity to related pollutant exposures in often-distant population centers (12). Satellite-based measures of smoke exposure are increasingly available and are appealing because plume monitoring intuitively links source and receptor regions. Such data, however, cannot yet be used to precisely measure smoke density or to separate surface-level smoke from smoke higher in the atmospheric column, and thus they are difficult to link to existing exposure–health response relationships (13, 14). Chemical transport models (CTMs), which can directly model the movement and evolution of wildfire emissions, offer an alternate approach for linking local pollution concentrations to specific fire activity. However, generating accurate exposure estimates from CTMs requires surmounting several major uncertainties in the pathway between source and receptor. First, large uncertainties in wildfire emissions inventories have been shown to lead to many-fold differences in wildfire-attributed (particulate matter with diameter <2.5 μm) concentrations across the United States (and >20× regional differences in high fire years) when different inventories are used as input to the same CTM (15, 16), and integration of satellite observations only slightly improves performance (17). Second, the detailed conditions surrounding emissions such as the height of emissions injections and very localized meteorology and their transport may not be captured by models and can dramatically impact downstream exposure estimates (18, 19). Finally, CTM representations of atmospheric chemistry may not accurately capture the evolution of wildfire smoke (20⇓⇓⇓–24). In addition to model-related uncertainty, the computational expense of running CTMs over large spatial and temporal scales means that models are rarely validated against the long time series of concentration measurements available from hundreds of ground stations across the United States.
Satellite Smoke Plume Images
To further understand the changing contribution of wildfire to particulate matter exposure across the United States and to illustrate key remaining scientific and policy questions at the intersection of wildfire, pollution, and climate, we train and validate a statistical model that relates changes in satellite-estimated smoke plume exposure and fire activity to ground-measured concentrations across regions in the United States (SI Appendix, Fig. S2). Our model is particularly trained to predict variation in over time at many individual locations—variation which is increasingly exploited to understand how changes in air pollutants affect key health outcomes. Our approach does not rely on uncertain emissions inventories and alleviates difficulties in modeling plume dispersion, and results can easily be validated against over a decade of ground data on which the model was not trained. Model estimates are robust to alternate ways of incorporating fire and plume data (SI Appendix, Fig. S3 and Tables S1–S3) and performance in predicting variation in overall is on par with benchmark remote-sensing–based approaches (SI Appendix, Fig. S4) and exceeds reported performance of CTMs (SI Appendix). We compare estimates from this reduced-form approach to other region-specific estimates of smoke concentrations in the literature, finding that our approach provides similar estimates of the share of overall from smoke as recent studies covering smaller regions or periods (SI Appendix, Fig. S5).
PM2.5 From WIldfires Contributing up to Half of All PM2.5 in the West
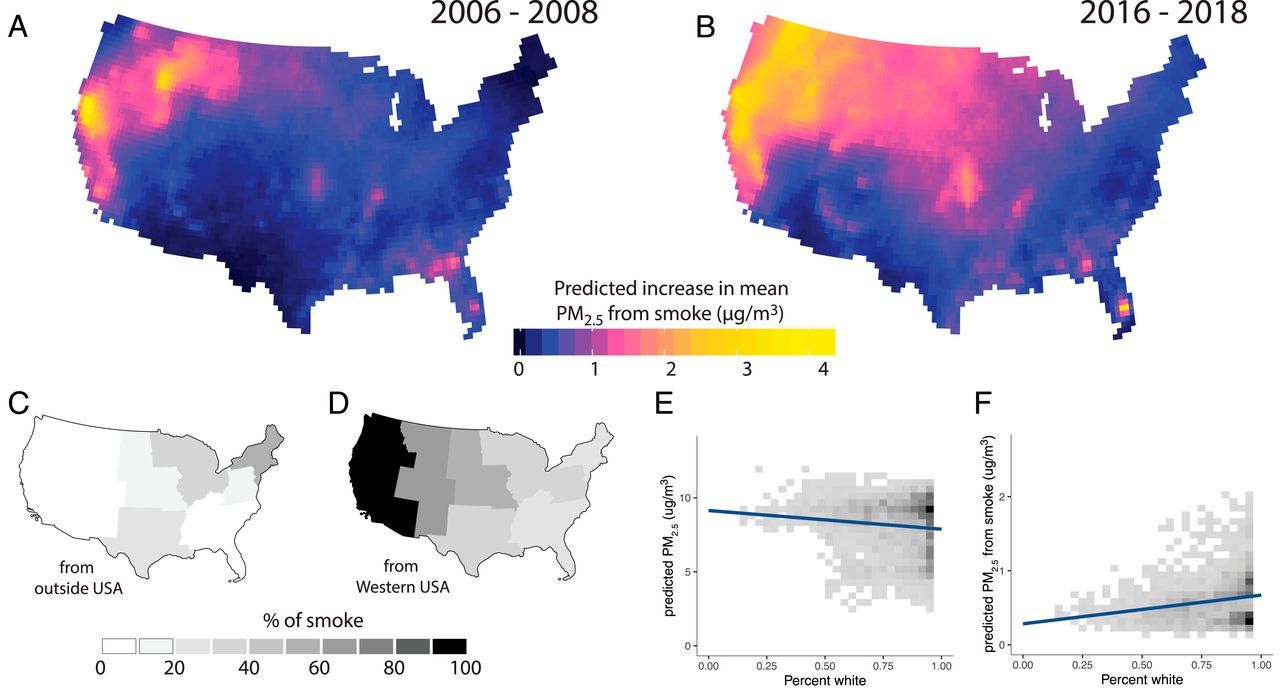
Our results show that the contribution of wildfire smoke to PM2.5 concentrations in the US has grown substantially since the mid 2000s, and in recent years has accounted for up to half of the overall PM2.5 exposure in western regions as compared to <20% a decade ago (Fig. 1H). While increases in contribution of smoke to PM2.5 are concentrated in the western US, they can also be seen in other regions (Fig. 2 A and B), a result of long-distance transport of smoke from large fires. Indeed, in midwestern and eastern regions of the United States, a growing share of smoke is estimated to originate from fires in the western United States or from outside the United States (13) (Fig. 2 C and D), mirroring recent findings on the substantial transboundary movement of overall within the United States (25). Exposure patterns are also pertinent to environmental justice debates: We find that while counties with higher proportions of non-Hispanic Whites in the population are less exposed to total , as has long been recognized in the environmental justice community, they are actually more exposed on average to ambient from wildfire smoke (Fig. 2 E and F). How these differences in ambient smoke-based exposure translate to actual individual exposures will depend on a variety of individual factors, including disparities in time spent outdoors and in the characteristics of indoor home and work environments, many of which could correlate with socioeconomic factors. For instance, infiltration of outdoor pollutants into homes is known to be higher on average for older, smaller homes and for lower-income households (26), and these differences could lead to disparities in overall individual exposure even if ambient exposures are not different.

The quantity, source, and incidence of wildfire smoke. (A and B) Average predicted micrograms per cubic meter of attributable to wildfire smoke in 2006 to 2008 and 2016 to 2018, as calculated from a statistical model fitting satellite-derived smoke plume data. (C) Share of smoke originating outside the United States, June to September 2007 to 2014 (calculated from ref. 13), with a substantial amount of smoke in the Northeast and Midwest originating from Canadian fires and about 60% of smoke in the Northeast originating outside the country; nationally, ∼11% of smoke is estimated to originate outside the country. (D) The share of smoke originating in the western United States, June to September 2007 to 2014. Smoke originating in the western United States accounts for 54% of the smoke experienced in the rest of the United States. (E and F) Racial exposure gradients are opposite for particulate matter from smoke compared to total particulate matter: Across the coterminous United States, counties with a higher population proportion of non-Hispanic whites have lower average particulate matter exposure but higher average ambient exposure to particulate matter from smoke (P <0.01 for both relationships).
What are the Future Policy Options?
These trends and patterns highlight important points of tension between existing air quality regulation and the growing threat from wildfire smoke and raise important unanswered research questions that will be critical to informing policy choice. Current approaches to regulation in the United States treat air quality primarily as a local problem, wherein counties are penalized if pollutant concentrations exceed designated short- or long-term thresholds. Current regulation under the Clean Air Act also potentially exempts wildfire smoke—but not smoke from prescribed burns—from attainment designation. These approaches appear at odds with the transboundary nature and growing contribution of wildfire smoke to air quality.
To better guide policy, a first key scientific contribution will be a better quantification of smoke exposures and agreed-upon methods for validating these exposures. Both statistical and transport-based approaches to exposure assessment have their strengths and shortcomings, and the performance of both should be evaluated based on metrics relevant to the measurement of downstream health responses. In particular, to isolate smoke exposure from potential confounds, most statistical approaches in recent health impact studies use variation over time in pollution exposure to estimate health effects. This implies that smoke models used for estimating health impacts should be evaluated in their ability to predict temporal variation in at relevant locations, not just spatial patterns in levels; most existing validation efforts focus on the latter. To guard against overfitting, these evaluations must be done on ground data not used in model training. Our model shows how a relatively simple statistical approach can reasonably accurately predict variation in smoke-based , but such approaches—either alone or in combination with CTMs—can likely be substantially improved. [While we do not consider them here, enhanced wildfire activity could also have meaningful negative impacts on water quality through increased runoff and subsequent suspension of particles, trace metals, and chemicals (27); better measuring these exposures and their health impacts is another key area for research.]
A second key scientific question is the nature of health responses to wildfire smoke. Growing evidence indicates a range of negative health consequence associated with wildfire smoke exposure (10, 28), consistent with a vast literature on the broader health consequences of polluted air. Most recent evidence suggests that there is no “safe” level of exposure to key pollutants such as (29, 30), but differences in the shape of the pollution–health response function at low levels of exposure can have large implications for the benefits of pollution reduction.
To illustrate this sensitivity, we combine pollution changes predicted from our statistical model with three recently published mortality response functions (29, 31, 32) to simulate changes in older-adult mortality predicted by various changes in exposure induced by mitigating wildfire smoke. Guided by existing estimates of how prescribed burning reduces subsequent wildfire activity (33) (SI Appendix), we evaluate stylized scenarios in which the use of prescribed burning changes the interannual distribution and overall amount of from smoke. Estimates of the annual number of lives saved among older adults for a given change in smoke differ by a factor of 3 across published response functions, implying large average differences in the benefits of smoke mitigation (Fig. 3). Evidence on whether certain populations are more susceptible to smoke exposure is also lacking (10, 28).

Health consequences of changes in smoke exposure depend on the assumed dose–response function and on the magnitude of management- or climate-driven changes in smoke. (A) Distributions of for all grid-cell years in the contiguous United States, 2006 to 2018, under several stylized wildfire management strategies and climate change scenarios (see SI Appendix for details). The baseline distribution of total predicted from all sources is in black. Gray distributions show alternative scenarios in which the timing and/or amount of overall smoke-related is altered through management interventions or increased due to climate, including the (hypothetical) full elimination of smoke . (B and C) Annual number of avoided premature deaths in the US population age 65+ y for each management strategy, calculated by combining the distributions in A with published long-run exposure–response functions depicted in C (29, 31, 32).
Wildfire Management Strategies
The large potential health benefits of smoke mitigation also raise key questions about wildfire management strategies. For instance, existing evidence does not provide a comprehensive understanding of how a given prescribed burning intervention will change the timing, amount, and spatial distribution of smoke, and we find that alternate estimates of the efficacy of prescribed burning in reducing the subsequent size of wildfires (33) can lead to more than twofold differences in estimated health benefits of prescribed burns (Fig. 3). Similarly, current fire suppression efforts understandably focus on protecting homes and structures, but the overall population health impact of a heavily polluting wildfire that does not threaten structures could be much worse than that of a smaller fire that does threaten structures. In addition, fuels management activities are targeted at local community protection and ecosystem benefits and do not consider likely downstream impacts of wildfire on large populations. Additional quantitative work is needed to help navigate these difficult trade-offs.
A third key question is whether source-agnostic -health–response functions are appropriate for estimating wildfire-smoke-specific health impacts. Although it is commonly hypothesized, existing literature is mixed on whether exposure to wildfire smoke has different health impacts than exposure to other sources of (34), with some evidence that differences are outcome specific (35). Improved science on this topic—including necessary investments in speciated monitoring to distinguish wildfire-specific pollutants—will be critical for understanding wildfire impacts.
Fourth, how might the interaction of climate change and wildfire risk shape policy priorities? A warming climate is responsible for roughly half of the increase in burned area in the United States (4), and future climate change could lead to up to an additional doubling of wildfire-related particulate emissions in fire-prone areas (36) or a many-fold increase in burned area (37, 38). Costs from these increases include both the downstream economic and health costs of smoke exposure, as well as the cost of suppression activities, direct loss of life and property, and other adaptive measure (e.g., power shutoffs) that have widespread economic consequences. It is currently unknown whether accounting for these wildfire-related costs meaningfully increases the estimated overall economic damages from climate change.
What Will This Cost?
To begin to quantify the possible cost of climate-induced wildfire increases, we use our statistical model and stylized scenarios to calculate the change in smoke exposure and resulting mortality associated with projected increases in wildfire risk. Using projected increases in future smoke broadly consistent with existing literature (36⇓–38), we calculate that increased mortality from climate-change–induced wildfire smoke could approach projected overall increases in temperature-related mortality—itself the largest estimated contributor to economic damages in the United States (39) (SI Appendix). More detailed studies are needed to refine these estimates in terms of their magnitude, their geographic specificity, and the particular subpopulations that might be the most affected. A key related policy question will be whether and to what degree to modify current exceptions to the Clean Air Act granted to states for pollution impacts from wildfire smoke, as these erode gains from efforts aimed at reducing from other pollution sources.
What is the Connection Between Wildfires and Covid-19 Infections?
Finally, wildfires have strongly interacted with the COVID-19 pandemic in ways that require further study. COVID-19 has to some degree impeded the ability of government and the private sector to respond to wildfire risk, before, while, and after fires occur. The scale of the 2020 wildfire season in many parts of the West, where drought in the 2019 to 2020 rainy season followed an accumulation of fuels during a relatively wet 2018 to 2019 season has presented particularly acute challenges. Wildland firefighter trainings were delayed or sometimes canceled, convict firefighter crews were unavailable due to early release from state prisons to avoid COVID outbreaks, many fuels management treatments did not occur in winter and spring, utilities faced at least some delays in wildfire risk reduction activities, and traditional approaches to wildfire evacuation have proved more challenging due to lowered capacity at evacuation centers resulting from social distancing requirements. It is currently unknown but probable that the historic fire season, and consequent smoke impacts, has also worsened COVID-related health outcomes, as early evidence suggests that exposure to air pollution increases both COVID cases and deaths in the United States (40, 41) (a finding consistent with the relationship between pollution and other viral respiratory illness) (42, 43). A better causal understanding of the impact of air pollution on COVID outcomes, including that from wildfires, is a critically urgent research priority, and scholars have provided guidelines on how air pollution/COVID relationships might be best studied (44). Findings from this research could be important in guiding labor- and finance-constrained firefighting effort and fuels management strategies as the pandemic continues.
Find more information about climate change.


